UCM6xxx series have integrated QueueMetrics which is highly scalable monitoring and reporting suite that addresses the needs of thousands of contact centers worldwide and offers a broad range of integrated benefits.
This guide outlines the setup steps for integrating QueueMetrics with UCM6xxx, offering call center managers a user-friendly tool for monitoring and managing their call center efficiently.
UCM6xxx is currently supporting the following features with QueueMetrics: Agent login, Agent Logoff, Realtime Monitoring-Pausing, Realtime Monitoring-Barging, Realtime Monitoring-Transferring, Realtime Monitoring-End calls, Generating Performance Report.
Supported Features
The UCM6xxx supports the following features using QueueMetrics. Each option will be explained and detailed in the sections below.
UCM Configuration for QueueMetrics
Prerequisites
On the UCM6xxx:
- Queue previously created.
- Extensions created and registered to serve as Dynamic agents.
On the QueueMetrics:
- Active account provided from QueueMetrics.
Configuration
After getting the account from QueueMetrics, The UCM6xxx needs to be publicly accessible and configured under Other Features🡪 QueueMetrics following the steps below:
- Toggle on Enable QueueMetrics Integration.
- Enter the QueueMetrics URL, Username and account code configured in QueueMetrics.
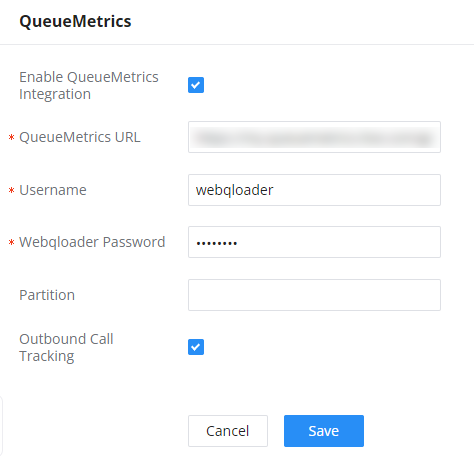
Parameter | Description |
Enable QueueMetrics Integration | Tick this box to enable QueueMetrics integration module. |
QueueMetrics URL | Enter the URL of the QueueMetrics on-premise server you have installed. (i.e. http://xxx.xxx.xxx.xxx:8080/queuemetrics.). |
Username | Please enter the username used to interface with QueueMetrics. This is typically the QueueMetrics webqloader user. Please confirm that the user is enabled to avoid connection failure. |
Webqloader Password | Please enter the webqloader password. |
Partition | Enter the data storage partition identifier |
Outbound Call Tracking | If enabled, QueueMetrics will track the outgoing calls of all extensions. Note: Outbound Call Tracking is available only on the UCM63XX. |
- Navigate to Other Features 🡪 AMI and create a new AMI user. The information below is just an example to show how the configuration is made:
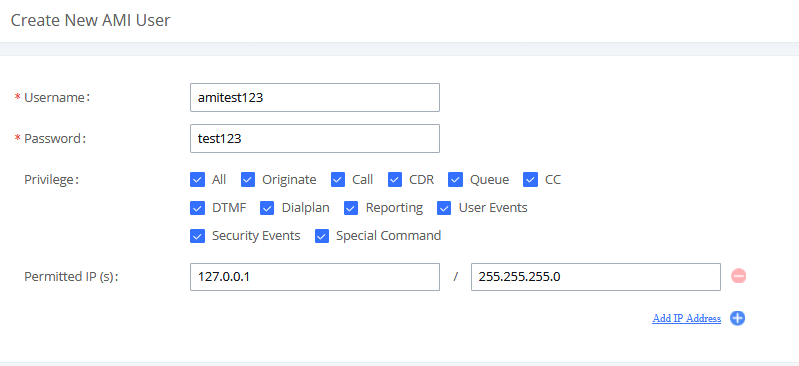
- Username: amitest123
- Password: test123
- Permitted IP(s): 127.0.0.1 / 255.255.255.0
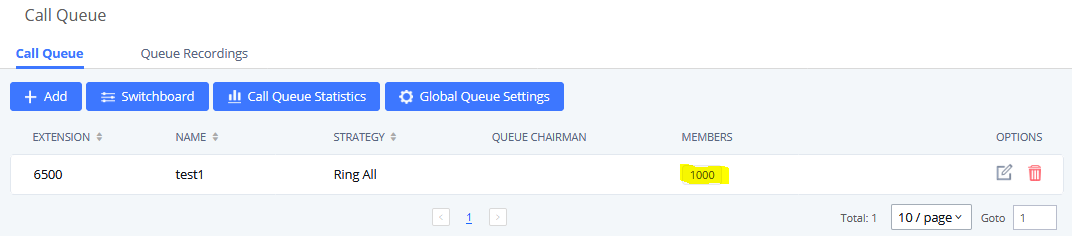
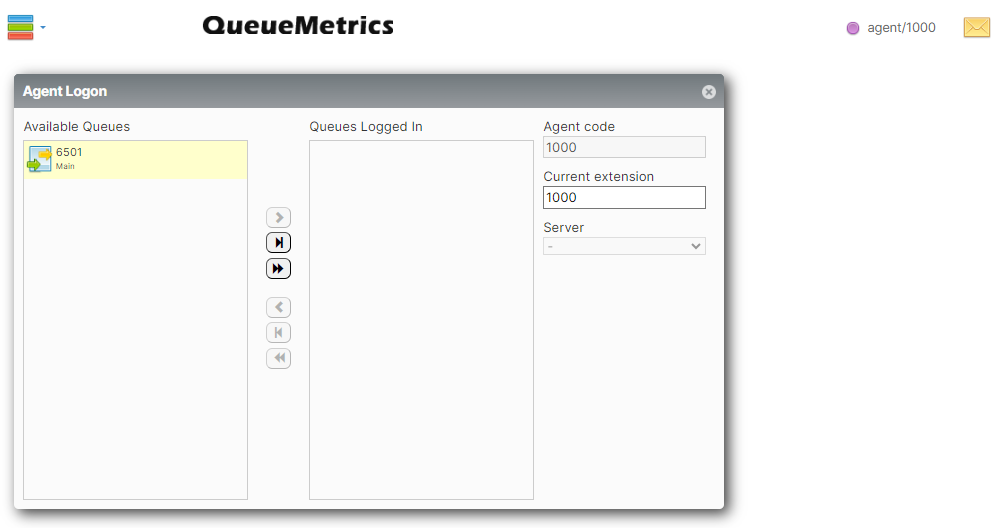
- Create and configure user extensions(agents) and a call queue on the UCM6xxx:
- Make sure that Enable Agent Login is not enabled to avoid agent login issues.
- Do not assign any extensions to be static agents.
In our example, we choose to create Queue 6500 and name it as QM_test and create two extensions 1000 and 1001 without adding them to QM_test.
QueueMetrics Configuration
Authentication
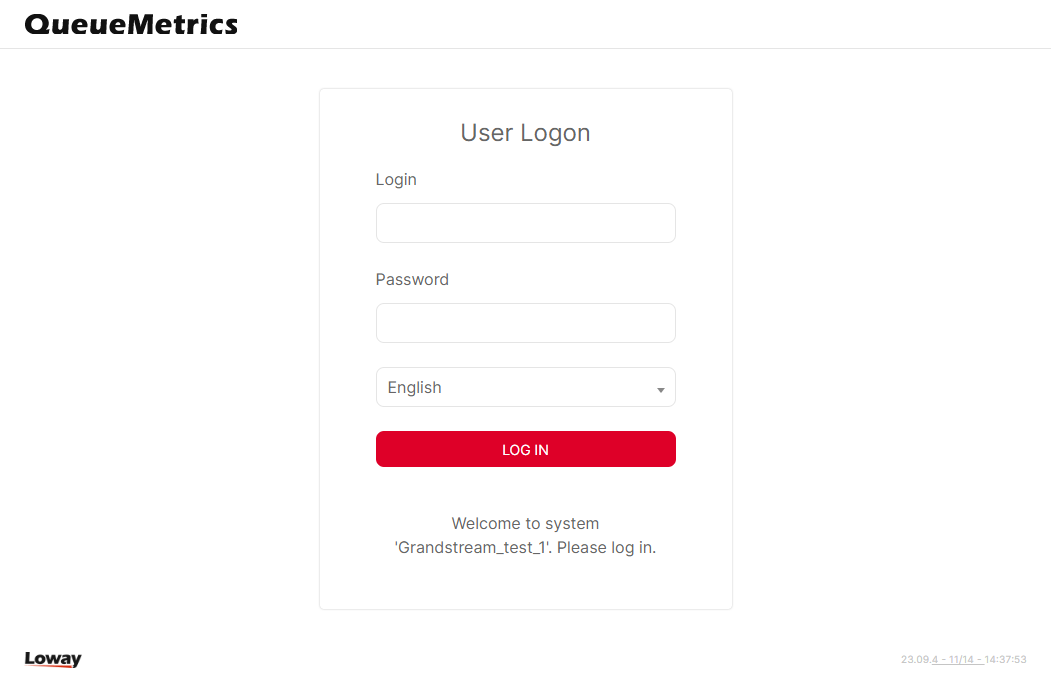
- Navigate to QueueMetrics web portal, for example: https://my.queuemetrics-live.com/test-account.
- Enter the admin login credentials assigned from QM on the authentication page as shown below:
- User can change the password for the account provided from QueueMetrics on web portal under Settings🡪Users.
Configuration
Configure AMI connection
In order for the UCM to communicate with QueueMetrics, the user needs to configure on QueueMetrics the same account for AMI that has been configured previously in the UCM, make sure to choose DirectAMI_Live as the PBX platform and specify the type of Channels as PJSIP. To do so please follow the steps below:
- Login in QueueMetrics.
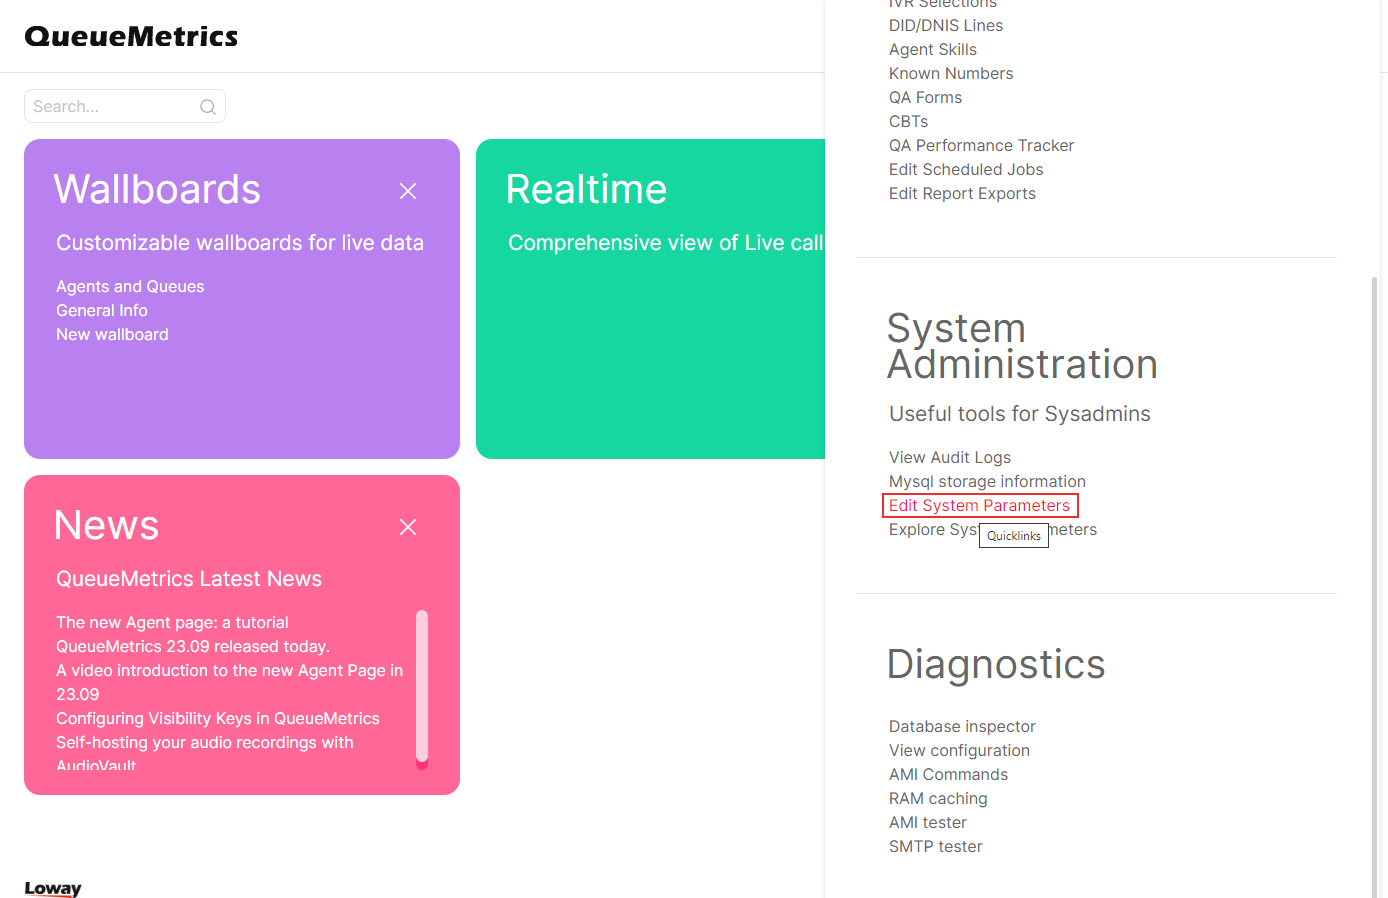
- On the home page of QueueMetrics, click on the settings icon
 on the top right corner of the page. Then scroll down to “System Administration” and click “Edit System Parameters”.
- Choose the type of PBX platform to be used which is in our case DirectAMI by editing the following line: platform.pbx=DirectAMI_Live
- Uncomment and edit the following lines:
callfile.dir=tcp:{AMIusername}:{AMIpassword}@{allowedIPaddress}:{AMIport}
In our case, to match the AMI credentials the line needs to be set to: callfile.dir=tcp:amitest123:test123@127.0.0.1:7777
platform.directami.extension=PJSIP/${num}
platform.directami.localext=PJSIP/${num}
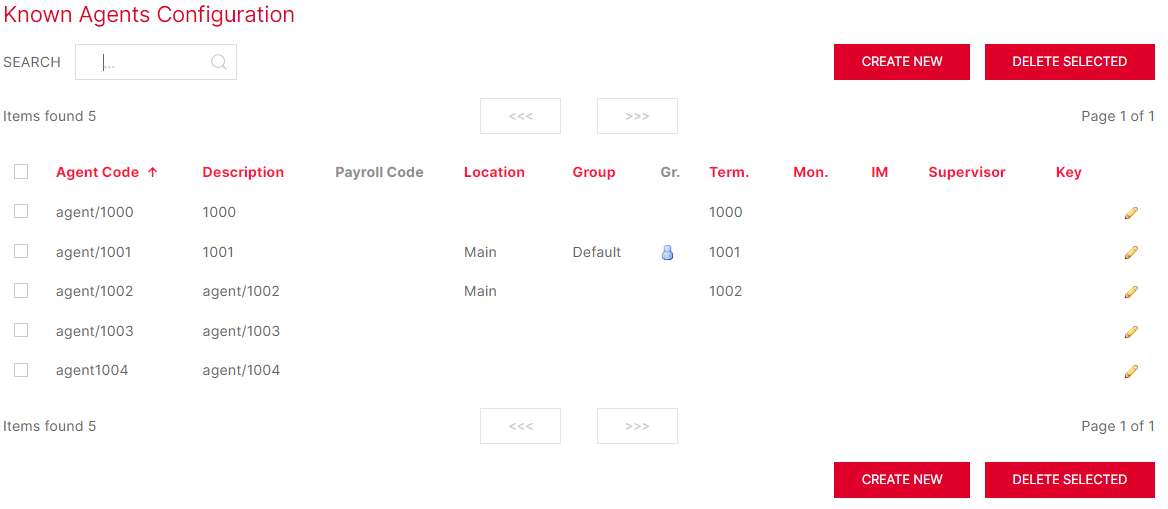
Creation of Agents
The same Agents that were created on the UCM need to be added on QueueMetrics in order to manipulate manage them.
To configure Agents, follow the steps below:
- Navigate to the Agents page.
- Create new agents for both extensions created on the UCM.
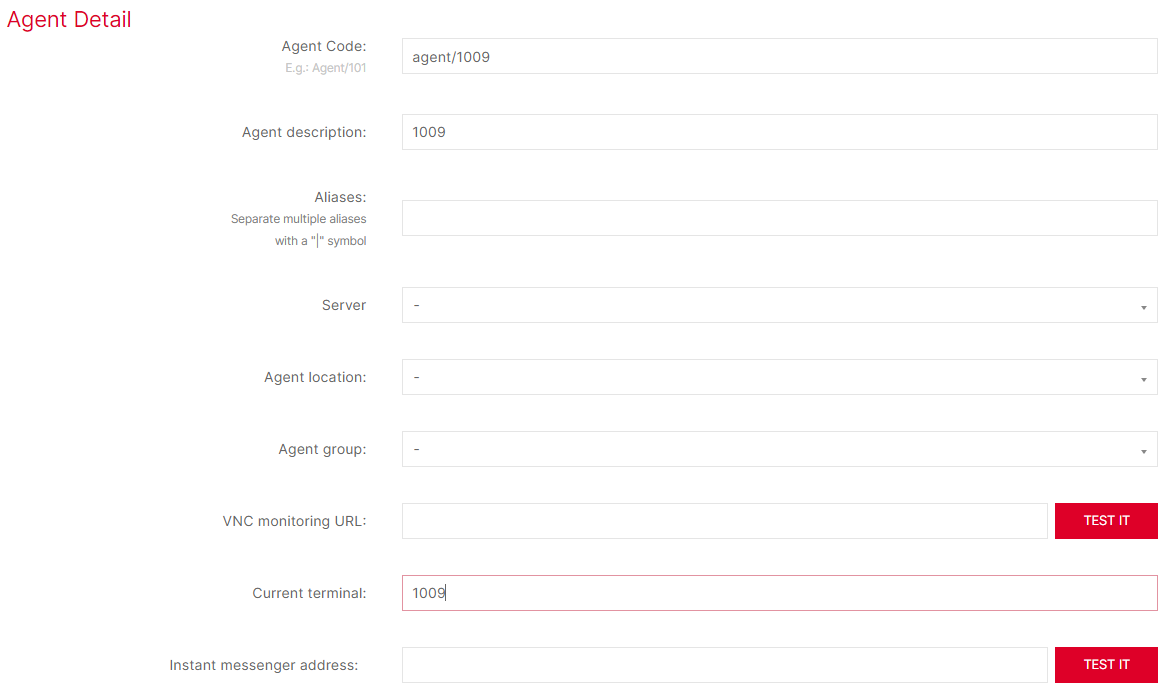
- Set Current terminal field to the extension number created on the UCM.
- Do the same config for the second agent 1001 as well.
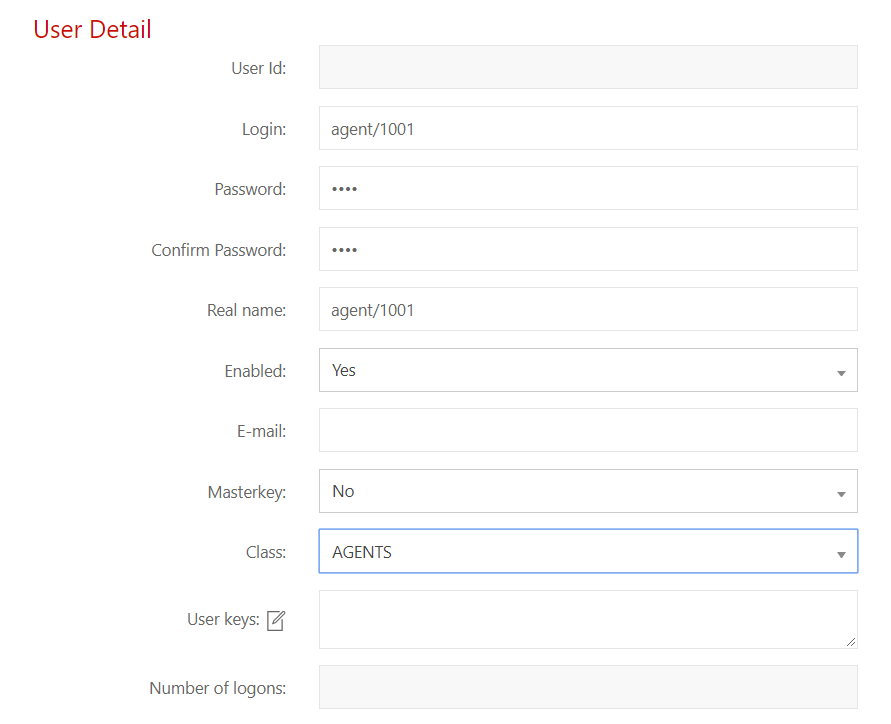
Creation of Users
The user account needs to be created for each agent so that they can use their user credentials to log into the web portal to manage queues and calls they are in.
To configure a user account, follow the steps below:
- Navigate to the User page and click on create new user.
- Set Login field to the same previous agent code configured for each agent.
- Set Class field to AGENTS.
Creation of the Queue
The same Queue number created on UCM6xxx needs to be created on QueueMetrics following the steps below:
- Navigate to the Queue page and click on create new.
- Set Queue alias to any name desired.
- Set Queue(s): to the extension number of the queue configured on UCM, in our example it is 6500.
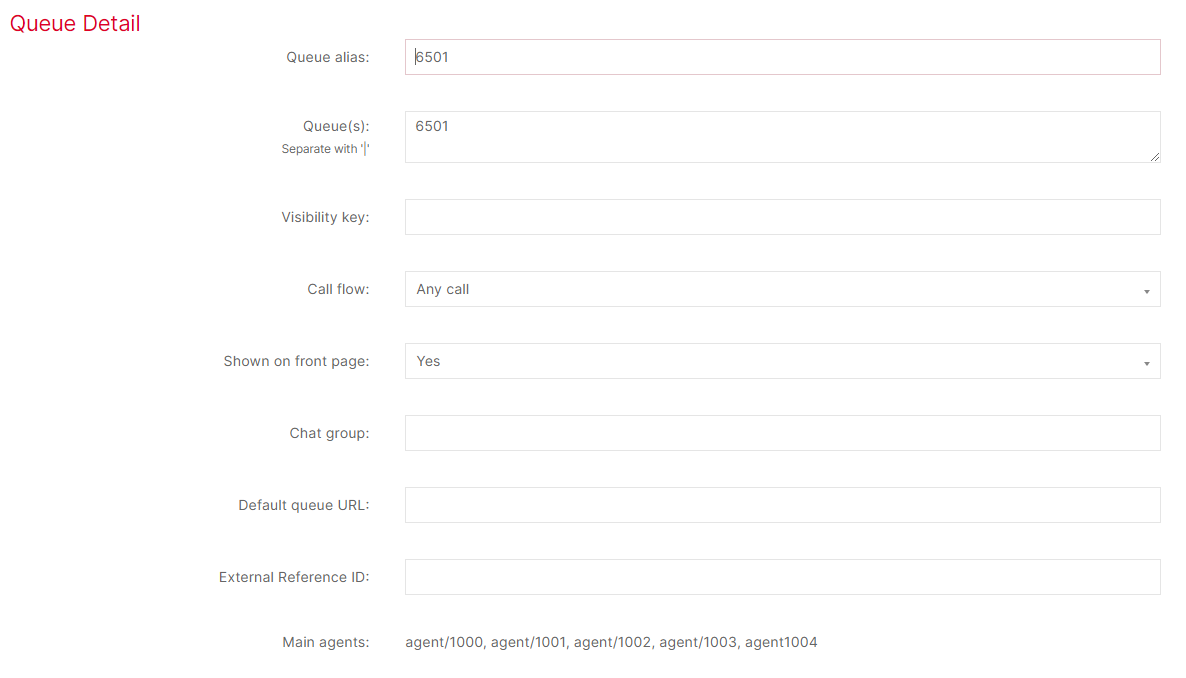
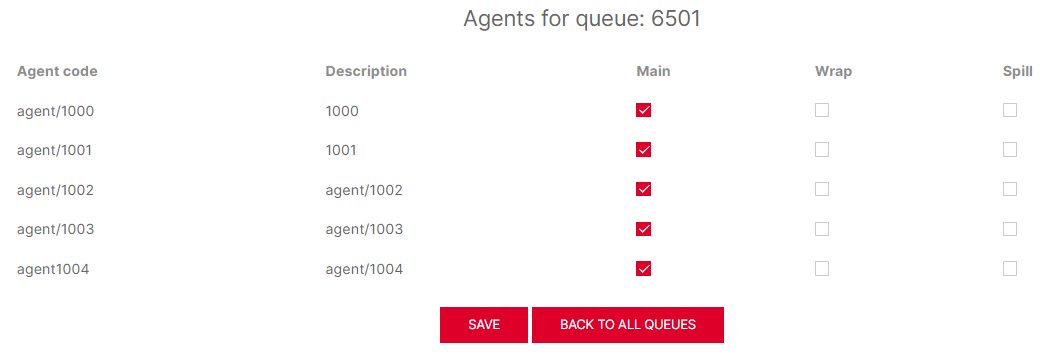
- Once the queue is created, on the main Queues page, edit the agents of queue 6500 and add the two newly created agents to this queue like shown below.

Supported Operations
Agent logon
To log into a queue from the user portal, please follow the steps below:
- Login using User credentials “login” and password created on User page.
- Go to the drop-down menu and select “agent logon”.
- Select the desired queues to log into and click on the [>] button.
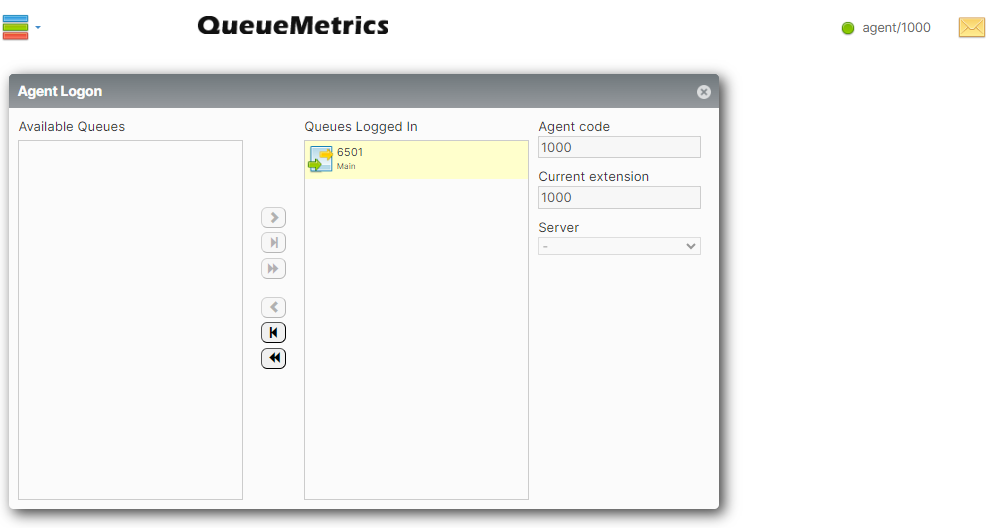
Agent logout
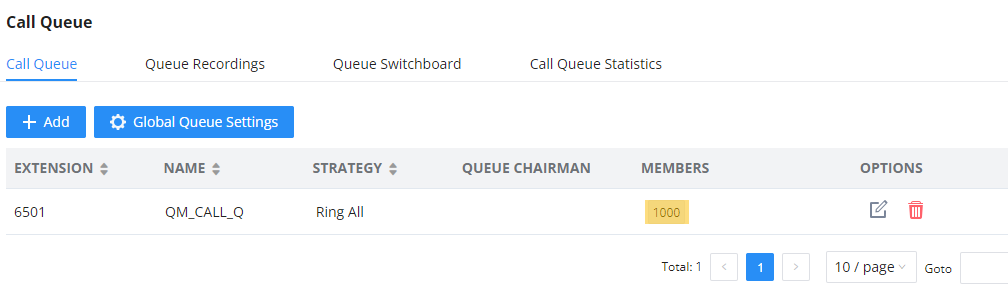
Logging out from the QueueMetrics user portal will remove the UCM extension from the UCM queue and it can be done by following the steps below:
- Login using User credentials “login” and “password” created on User page
- select again the desired queues and click this time on the [<] button.
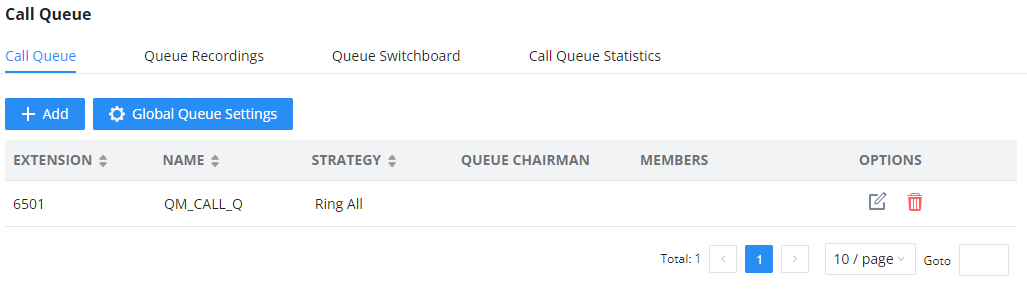
The extension will not be seen as part of the queue on UCM as shown below.
Realtime Monitoring
Realtime monitoring allows administrators to have an overview of queue agents and call activity and it can be accessed by clicking the “Start real-time monitoring” label from the home page. It will show a page similar to the one below:
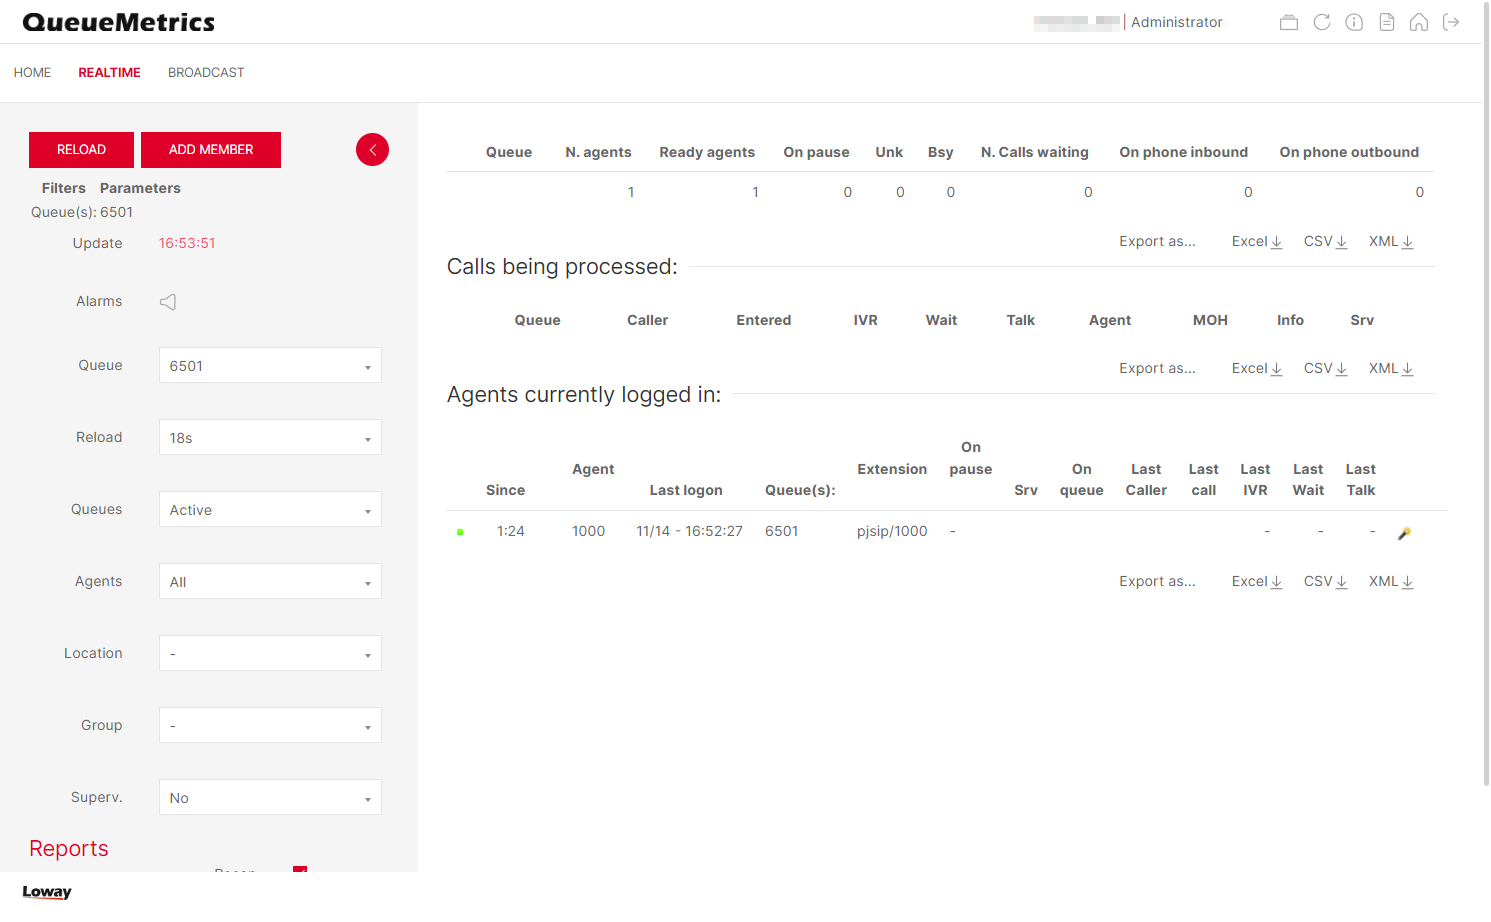
On the top of the page there is a control table showing the last update timestamp and other dropdown selectors as specified below:
- Reload: It defines the update period will be used to refresh the shown data
- Queues: Shows all queues or only active queues
- Agents: Toggle between all agents or members only agents
- Location: If granted by user permissions, defines which location is shown
- Group: Defines which agent group is shown
- Superv.: Filter out agents not supervised by current user
- Reports: Displays Recap, Calls being processed, and Agents logged in when the options are toggled on.
Active calls will be displayed under the Calls being processed section and logged-in agents will be shown under the Agents currently logged in section. If this page does not display anything, please check your UCM configuration and make sure the Account Code is correct.
In addition to monitoring agent activity, administrators can also barge into calls, pause/unpause agents, and close calls like detailed in the below sections.
Realtime Monitoring – Pausing
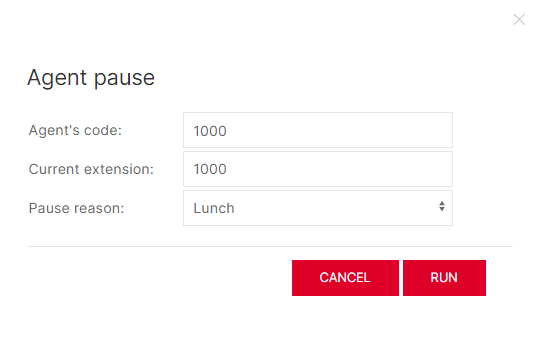
Agents can be paused so that they will not receive calls and the administrator can control that by following the steps below:
-
Click on the icon
 next to the agent.
- Click on Pause agent and select the pause reason (Lunch, Hourly break, Email, Backoffice, Wrap).
- Click on “RUN” button.
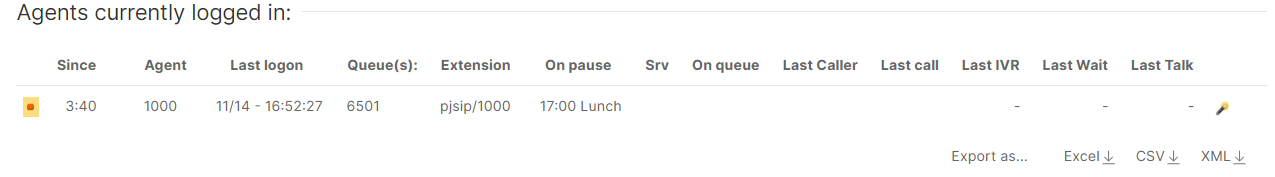
When pausing or unpausing an agent, it may take sometime for the agent for the pausing/unpausing to take effect.
Once the agent is paused, Field “on pause” on the recap will be updated with the number of agents actually being paused.
As the administrator can control pausing agents, agents themselves can do the same operation when they log in on the QueueMetrics user portal by following the steps below:
- Login using User credentials “login” and password created on User page.
- Go to the drop-down menu and select “Pauses”.
- Select the desired pause reason and click on pause.
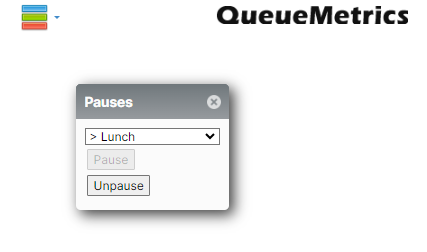
Agent Status will move now from green to red as shown on the top right corner.
Realtime Monitoring – Barging
When there is an active call between an agent and an external number showing under Realtime monitoring> Calls being processed, other stations like the extension of the supervisor can monitor and join the call to spy on it.
To spy on agent call, follow the steps below:
- Access Start realtime monitoring page.
- Under call being processed, look for the call you want to spy on it.
- Click on
 on the left corner and choose option Monitor now.
 - Set the field “Your extension” to the extension number of the Spy station.
- Click on “Monitor now”.
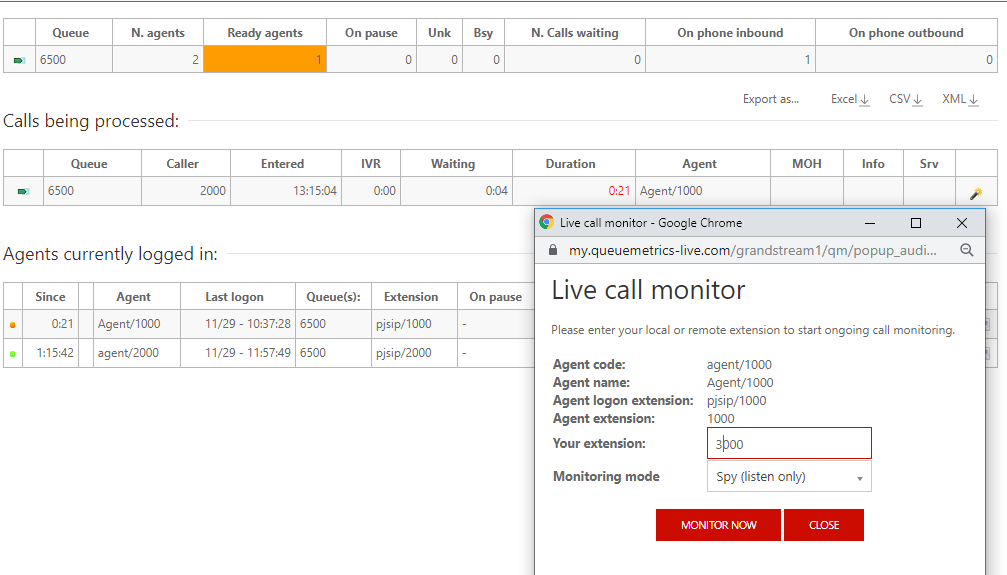
Once you click on the option “Monitor now”, a call will be sent to Station having extension 3000, and answering that call will allow this station to spy on the agent call and hear the conversation between him and the external number.
Realtime Monitoring – Transferring
This feature allows to transfer calls to other agents if necessary when they are available under Realtime monitoring> Calls being processed.
To transfer an ongoing call, follow the steps below:
- Access Start realtime monitoring page.
- Under call being processed, look for the call you want to transfer it.
- Click on the left corner and choose option Transfer.
- Set the field “Transfer to extension” to the extension number where you want to transfer the call.
- Click on “Transfer” Button.
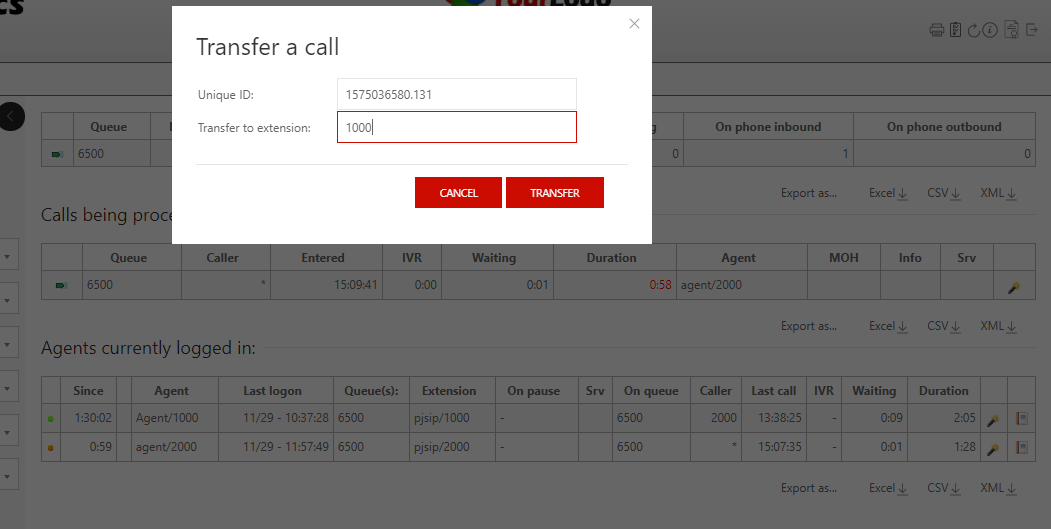
Once you click on the Transfer button, the call will be blind transferred to the extension number set on the field “Transfer to extension”.
Realtime Monitoring – Hangup
The supervisor can force to end a call on behalf of the agent when necessary.
To hang up an ongoing call, follow the steps below:
- Access Start realtime monitoring page.
- Under call being processed, look for the call you want to end.
- Click on the left corner and choose option Hangup.
- Click on “Hang up” button.
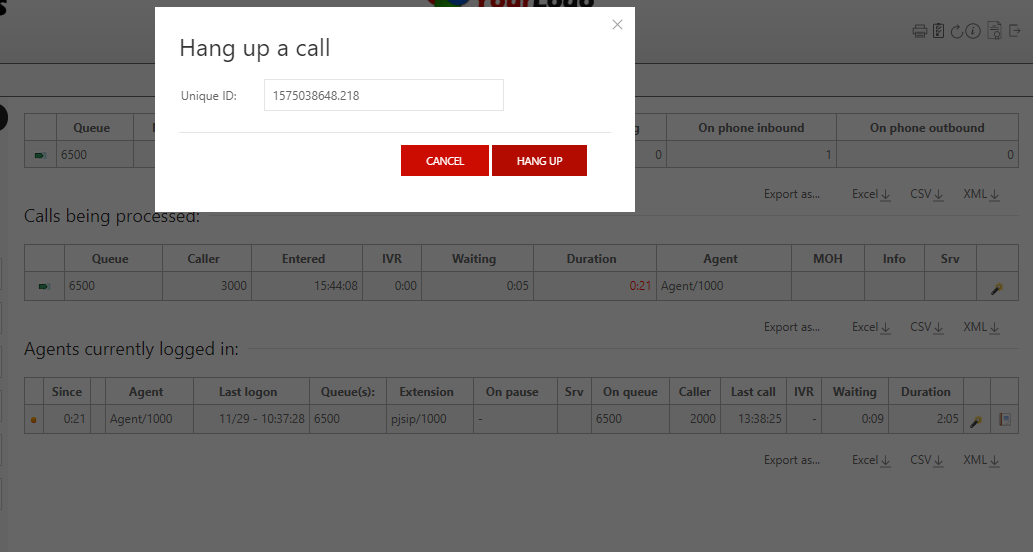
Once done the action Hang up will be performed but it may take a few seconds to take place.
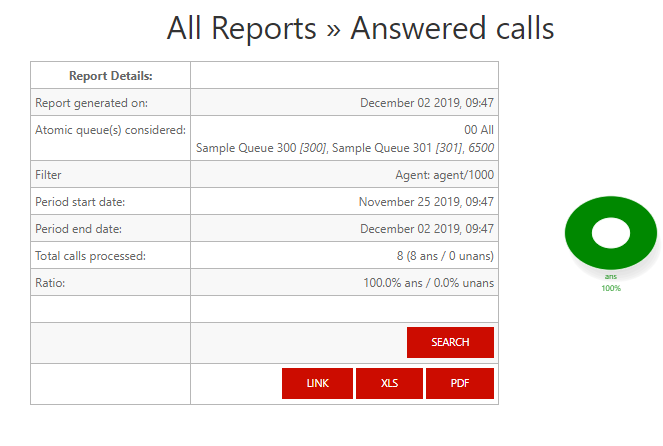
Generating Performance Report
One of the main functions of the Integration of QueueMetrics is getting and generating call center performance reports: answered/unanswered call details, agent session details, call breakdown for a time period, etc.
This section is accessible either by accessing the Agent report on the home page or under Realtime monitoring> Agents currently logged in by clicking on the icon ![]() next to the agent.
next to the agent.
Once there, the top panel will show the following:
- Time when the report is generated
- Automatic queue(s) generated which is the queue or composite queue you want to analyze
- Filter is the call filtering criteria which can be specified by clicking on the button “Search”
- Start and end date let you select the period you want to analyze, which can be defined also by clicking on “Search”.
- Total calls processed gives the amount of the answered and unanswered calls.
- Ratio is the percentage of the answered and unanswered calls with a graph presentation next to it.
All calls report
The answered calls section deals with calls that were correctly handled by agents.
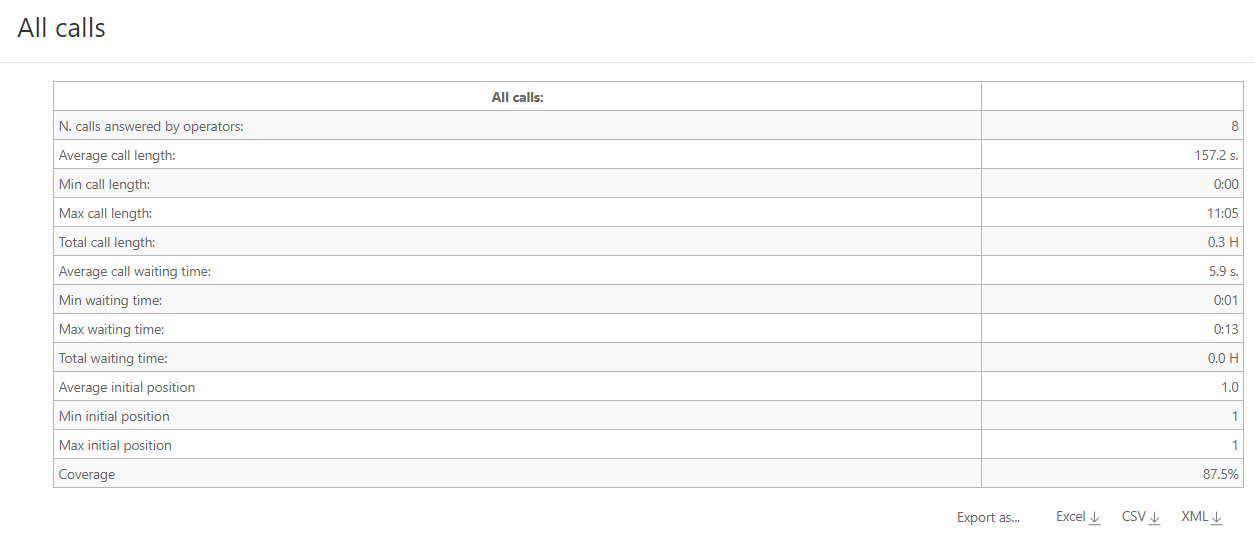
The top panel shows:
- How many calls were handled.
- The average call length which is the time the caller spends talking to an operator).
- The maximum and minimum call lengths recorded for the given time period.
- The total call length (for all calls on all operators).
- The average call waiting time (i.e. the time a caller was waiting on a queue before being connected to an operator).
- The minimum and maximum call waiting times on record.
- The total waiting time for all handled calls.
- The average initial position of the call in the queue.
- The minimum and maximum initial queue positions that have been detected.
- The queue position coverage: as this information is not tracked for all calls, this ratio shows the average number of calls that had queue position record.
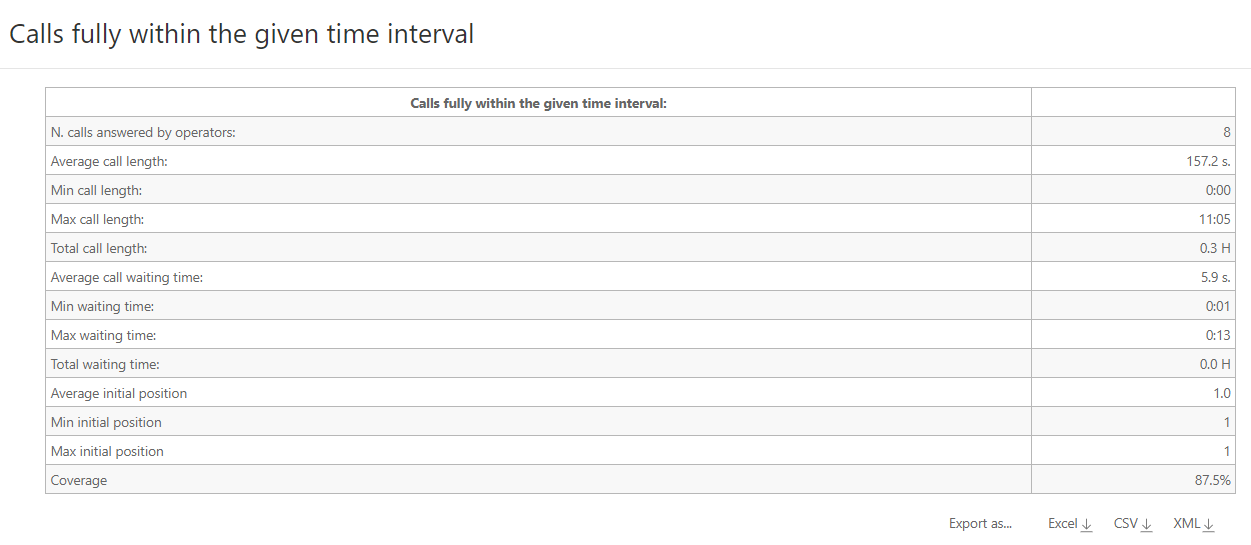
Calls fully within the given time interval
The answered completed calls section deals with calls that were correctly handled by agents. This is similar to what is reported on the previous panel but may exclude calls that were started before or terminated after the given time frame.
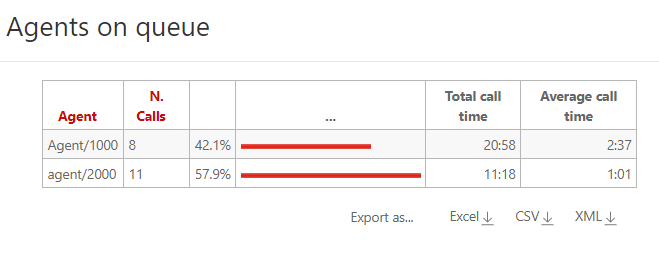
Agents on Queue
This report shows which agents have been available for the given queue, how many calls each one handled, and the percentage of all calls that each one handled.
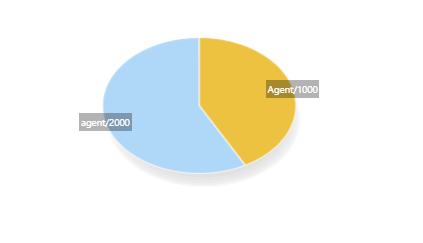
The graph below shows which agents have been available for the given queue representing the percentage of all calls that each one handled.
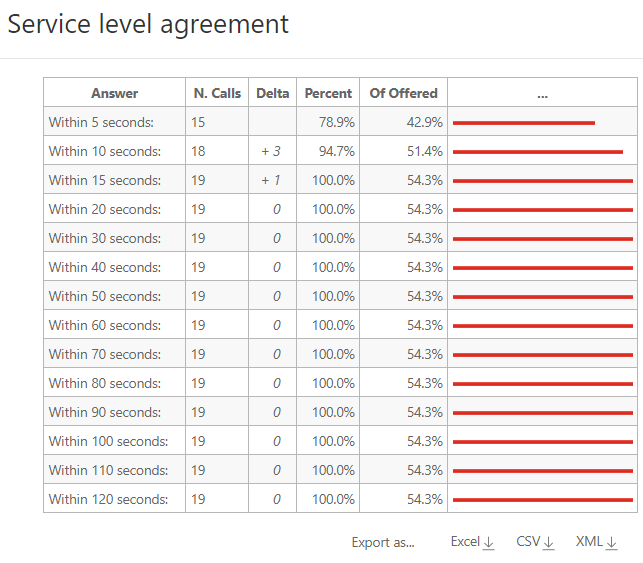
Service level agreement report
This report shows the distribution of call waiting times. It shows how many calls were answered within a given time frame, usually 120 seconds in 10 seconds.
This graph will provide a percentage of how many calls were answered within X seconds; the percentage includes calls answered in a shorter time frame and therefore grows with time. The “delta” value you see is the absolute increment, expressed in the number of calls, between each time frame, while the “Offered” column displays the result of the taken calls divided by the total taken plus the total lost. This metric is computed only on answered calls, ignoring lost calls.
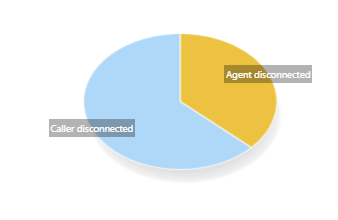
Disconnection causes report
This report shows the reason calls were terminated.
The supported reasons are:
- The agent hung up
- The caller hung up,
- The call was transferred outside the queue and the agent was freed again.
- The call was ongoing at the time the report was run.
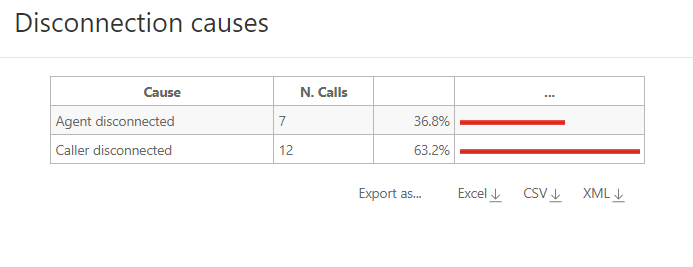
The graph reports the percentage values associated with the reason why calls were terminated, as calculated in the table.
Note: For more details please refer to the QueueMetrics User Manual guide: https://downloads.loway.ch/manuals/
Partition
QueueMetrics is able to monitor clusters of Asterisk servers, in order to monitor large call centers that are spread over a number of physical machines. This setting is often used for large deployments of UCM6xxx, as it leads to a number of advantages:
- The overall call center is safer, as the failure of one single UCM leads to a down of only part of the call center and not its entirety.
- The call center can easily grow to hundreds of seats simply by adding more UCMs, without special optimizations or configurations.
- Ability to have multiple UCMs working together as if they were one single box.
Setup and Configuration
In our Scenario, we are going to use a cluster of two UCMs that will be monitored with the same account provided by QueueMetrics.
Configuration on QueueMetrics
In our case, we have a cluster of two UCMs, so the below configuration needs to be done and executed on QueueMetrics settings Under Home 🡪 Edit System Parameters:
- The value default.queue_log_file needs to be set to cluster:*
- The Value cluster.servers needs to be set to the servers names separated by a pipe.
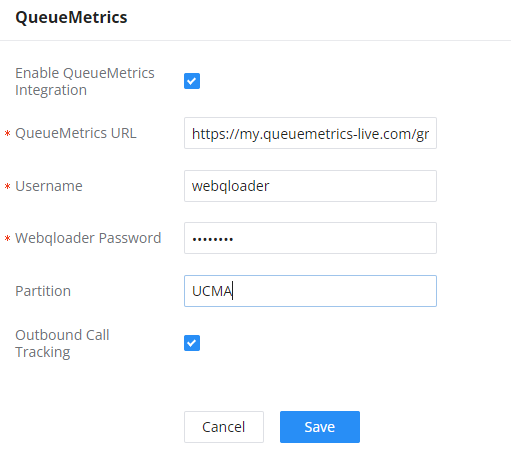
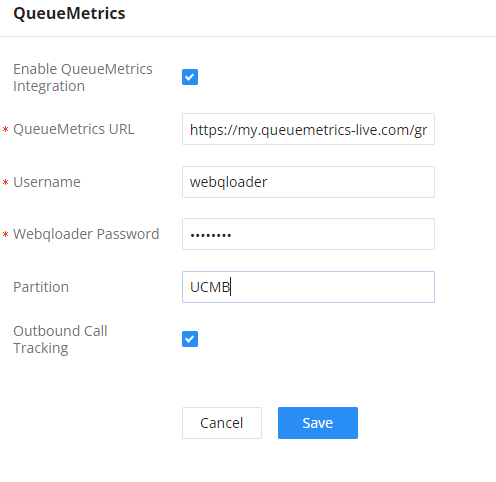
Example: cluster.servers=UCMA|UCMB, For each of them, put these values, replacing ‘servername’ with the name you have chosen.
- Set cluster.servername.manager=tcp:user:pass@serverhost, where user:pass are the credentials for the Asterisk’s AMI interface configured on the UCM.
- cluster.servername.queuelog=sql:partition-name, in our case the partition name is UCMA and UCMB.
To summarize, this is what the configuration in QueueMetrics should look like:
default.queue_log_file=cluster:*

cluster.servers=UCMA|UCMB

cluster.UCMA.manager=tcp:amitest123:test123@127.0.0.1:7777
cluster.UCMA.queuelog=sql:UCMA
cluster.UCMA.monitored_calls=z:/qm_streamcall/server_aleph
cluster.UCMA.callfilesdir=
cluster.UCMA.audioRpcServer=
cluster.UCMA.agentSecurityKey=
cluster.UCMA.websocketurl=ws://10.10.3.5:8088/ws
cluster.UCMA.rtcWebBreaker=false

cluster.UCMB.manager=tcp:amitest456:test456@127.0.0.1:7777
cluster.UCMB.queuelog=sql:UCMB
cluster.UCMB.monitored_calls=z:/qm_streamcall/server_trix
cluster.UCMB.callfilesdir=
cluster.UCMB.audioRpcServer=
cluster.UCMB.agentSecurityKey=
cluster.UCMB.websocketurl=ws://127.0.0.1:8088/ws
cluster.UCMB.rtcWebBreaker=false
Configuration on UCMs
Under Other Features 🡪 QueueMetrics on each UCM, set the Partition field to the same value as the servername configured on QueueMetrics, then disable/enable the configuration to take effect.